| Panes button |
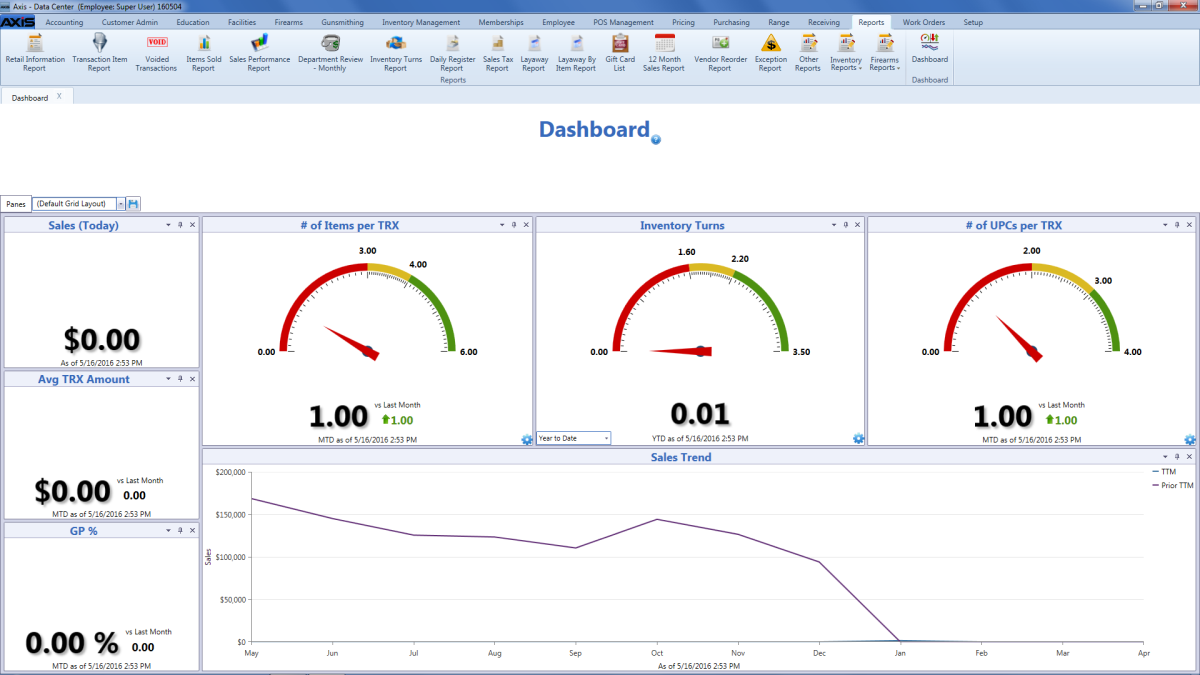
Click the Panes button to display a list of available panes. Uncheck a pane to remove it from the screen. Check a pane to add it to the screen.
|
|
Grid Layout Controls
|
Complete the following to save a layout:
- Select the desired combination of filters, sorts, groupings, etc.
-
If desired, enter a new name for the layout in the Default Grid Layout field.
Note: Unlike most screens, this screen allows the user to click the Save button when the Default Grid Layout option is active, thereby changing the default layout.
-
Click the Save button beside the field to save the current layout under the name in the field.
Select the desired layout from the Default Grid Layout drop-down to recall that layout.
Note: Select the Default Grid Layout option to recall the default layout.
|
| Sales (Today) pane |
The Sales (Today) pane displays the store's total sales for the current day.
Note: Refer to the Sales Total value on the Retail Information Report screen to reference this pane's value.
|
| Avg TRX Amount pane |
The Avg TRX Amount pane displays the store's average transaction amount on a Month-to-Date basis and compares it to the previous month.
Note: Refer to the total Sold Price value on the Transaction Item Report screen and divide by the TRX Count value to reference this pane's value.
|
| GP % pane |
The GP % pane displays the store's Gross Profit Percent as a percent rounded to two decimal places and compares it to the previous month.
Note: Refer to the total GP % value on the Transaction Item Report screen to reference this pane's value.
|
| # of Items per TRX pane |
The # of Items per TRX pane displays the store's average number of line items per transaction on a Month-to-Date basis and compares it to the previous month.
Note: Refer to the footer on the Sales Performance Report screen to reference this pane's value.
|
| Inventory Turns pane |
The Inventory Turns pane displays the store's Inventory Turns calculated per the timeframe (Year to Date, Trailing 6 Months, or Trailing 12 Months) selected from the drop-down menu.
Note: Refer to the Inventory Turns Report screen to reference this pane's value.
|
| # of UPCs per TRX pane |
The # of UPCs per TRX pane displays the store's average number of unique UPCs per transaction on a Month-to-Date basis and compares it to the previous month.
Note: Refer to the footer on the Sales Performance Report screen to reference this pane's value.
|
| Sales Trend pane |
The Sales Trend pane displays the store's total sales, COGS, and GP% for a rolling 24-month period. The TTM line represents the 12 most recent completed months, while the Prior TTM line represents the 12-month period prior to them.
Note: Refer to the Retail Information Report screen or the Sold Price value on the Transaction Item Report screen to reference Sales values.
Refer to the Transaction Item Report screen to reference COGS and GP % values.
|


![]() Data Center ribbon menu.
Data Center ribbon menu.![]() Dashboard screen.
Dashboard screen.![]() onscreen features.
onscreen features.