| Case UPC and Unit UPC fields |
If the item is a unit UPC associated with a case UPC, the Case UPC field is displayed. The user may click the Case UPC field to display the case UPC's Sales Analysis tab.
If the item is a case UPC associated with a unit UPC, the Unit UPC field is displayed. The user may click the Unit UPC field to display the unit UPC's Sales Analysis tab.
|
| Calculation Data section |
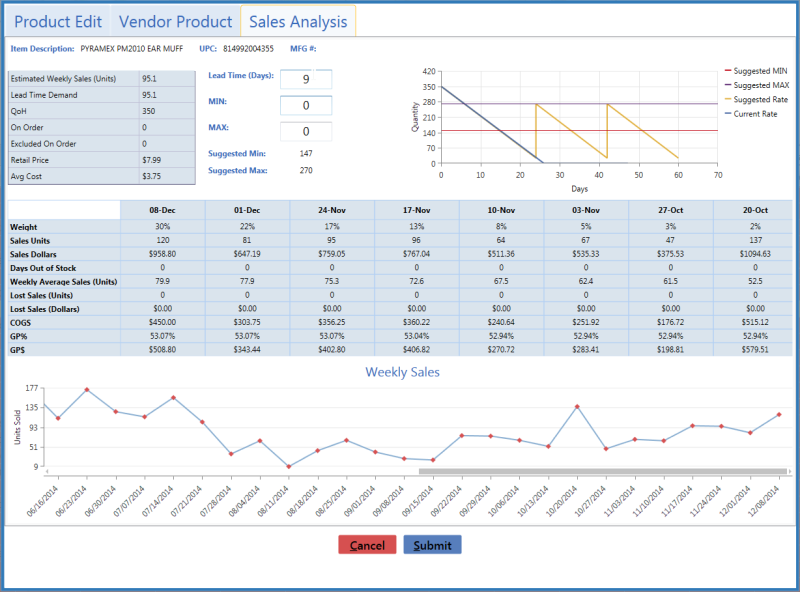
The Calculation Data section includes the Estimated Weekly Sales (Units), Lead Time Demand, QoH, On Order, Excluded On Order, Retail Price, and Avg Cost fields. Some of these fields may be edited on the Sales Analysis tab. |
| Lead Time (Days) field |
The Lead Time (Days) field reflects the value displayed in the Lead Time Days field on the vendor's Vendor Information for screen. The user may temporarily adjust this value on this tab to display its effect on calculations, but it can only be permanently changed on the vendor's Vendor Information for screen. Refer to Manage Vendor Records for more information.
|
| MIN and MAX fields |
The MIN and MAX fields reflect the item's current minimum and maximum values (respectively). They may be edited on this tab. |
| Suggested Min and Suggested Max fields |
The Suggested Min and Suggested Max fields reflect the suggested minimum and maximum values (respectively). The system calculates these values according to the item's lead time, lead time demand, safety stock percentage, relative weekly weights, and estimated weekly sales.
Note: If an item does not have 8 weeks of sales data or the item was out of stock for more than 50% of the 8-week period, the suggested values will be "0."
If the Lead Time Days field is not populated, the suggested values will be "N/A."
|
| Saw Tooth Graph section |
The Saw Tooth Graph section presents a graphic representation of comparative inventory levels over the past year. This graph allows the user to identify how changes to min/max levels can help avoid overstock and out of stock situations.
|
| 8-Week Sales Data section |
The 8-Week Sales Data section includes the Weight, Sales Units, Sales Dollars, Days Out Of Stock, Weekly Average Sales (Units), Lost Sales (Units), Lost Sales (Dollars), COGS, GP%, and GP$ fields.
Note: The Days Out Of Stock, Lost Sales (Units), and Lost Sales (Dollars) fields display values for items that go out of stock after the system software is updated. Values are not calculated for items that are or were out of stock prior to the update.
|
| Weekly Sales section |
The Weekly Sales section presents a graphic representation of weekly sales over a 52-week period. The user may hover over a week's red diamond to display data from that week.
|


![]() Navigate to the Product Details window.
Navigate to the Product Details window.![]() onscreen features.
onscreen features.